
 Markets
 Referral & Affiliate
 Rewards
 Products
 Support Center
 News
News Research
 Download
 English(Australia)
What Is Technical Analysis?
2023/03/03 14:24:00
Technical Analysis, or TA for short, is a popular method among traders and investors for evaluating market trends and making informed decisions. It involves the study of past price and volume data to predict future market behavior, and has been widely applied in both traditional financial markets and the rapidly growing cryptocurrency market. In this article, we'll delve deeper into what technical analysis is, how it works, and its significance in the world of trading and investing.
What is the Definition of Technical Analysis in Crypto?
Technical Analysis is a technique for predicting future prices or market trends by examining data such as prices, quantities, graphs, indicators, and other market information. The origins of technical analysis date back to the 17th century, but it gained popularity in the 19th century when securities trading grew in the United States. Investors sought a way to predict market movements, leading to the widespread acceptance of technical analysis.
Initially, technical analysis was used for conventional financial market commodities like currencies, stocks, and futures. However, due to its simplicity, the same technical indicators such as price, volume, and moving averages can be applied to predict cryptocurrency market prices.
How Technical Analysis Works and Its Significance?
The basis of technical analysis is the belief that prices are influenced by supply and demand and market sentiment. Technical analysis therefore involves analyzing past stock price and volume data to predict future market trends, which reflect changes in supply and demand. The significance of technical analysis lies in its ability to provide valuable insights into market trends, price prediction and potential future price movements. By combining technical analysis with other forms of analysis and market research, traders and investors can make informed decisions and potentially increase their chances of success in the market. It should be noted, however, that technical analysis is not a foolproof method and past performance does not guarantee future results. As with any form of investing or trading, it is important to carefully consider all relevant information and to understand the risks involved.
Technical analysis is crucial in trading due to its impact on several key factors:
Real-time market trend monitoring: Technical analysis enables traders to keep a close eye on market trends by analyzing data and identifying trade opportunities.
Streamlining: The process of transforming vast amounts of data into easily digestible indicators makes it easier to make informed trend assessments.
Strategy development: The insights gained from technical analysis can help traders formulate clear and effective trading strategies.
Risk management: By conducting technical analysis, traders can gain a deeper understanding of the market and minimize potential risk.
Difference Between Fundamental Analysis vs. Technical Analysis
Fundamental Analysis and Technical Analysis are the two main approaches used to evaluate and analyze financial markets, including stocks, bonds, commodities, and currencies.
Fundamental Analysis focuses on evaluating a company's financial and economic data, such as its financial statements, revenue, earnings, and industry conditions, to determine its intrinsic value and future potential for growth. This approach aims to identify undervalued companies that have the potential for long-term growth.
Technical Analysis, on the other hand, uses historical market data such as price and volume to predict future price movements and market trends. This approach does not consider a company's fundamental data and instead assumes that all relevant information is already reflected in the current market price. Technical analysts look for patterns in the price and volume data to identify buying and selling opportunities.
Both methods are widely used and have their own strengths and weaknesses. However, due to the fast-paced nature of the cryptocurrency market, technical analysis is often more commonly used to determine market trends as it is better suited to quickly adapting to changing market conditions.
Common Technical Analysis Indicators
Common Technical Analysis indicators are used to analyze price and volume data and include Moving Averages, Bollinger Bands, RSI, Stochastic Oscillator, MACD, Fibonacci Retracements, and Candlestick patterns. These indicators help investors make informed decisions. Despite the abundance of technical analysis indicators, not all of them can accurately predict the market. Each indicator has its own commodity and cycle, as well as its own distinct trading strategy. This is especially true in the volatile cryptocurrency market where conditions are constantly changing. To increase profits and minimize investment risk, it is advisable to use a combination of multiple indicators.
Moving Averages
Moving Averages are the most widely used and well-known trend indicator in technical analysis. They show the trend of stock prices and are the simplest of all technical analysis indicators, making them easy to calculate and understand. The parameters of the averages can be adjusted according to the underlying assets and period being analyzed for a more precise frequency of analysis. A Moving Average can serve as a crucial trading signal, providing insight into the current market trend. When the asset price crosses above the moving average, it indicates a potential buying opportunity, and when it crosses below, it signals a potential selling opportunity.
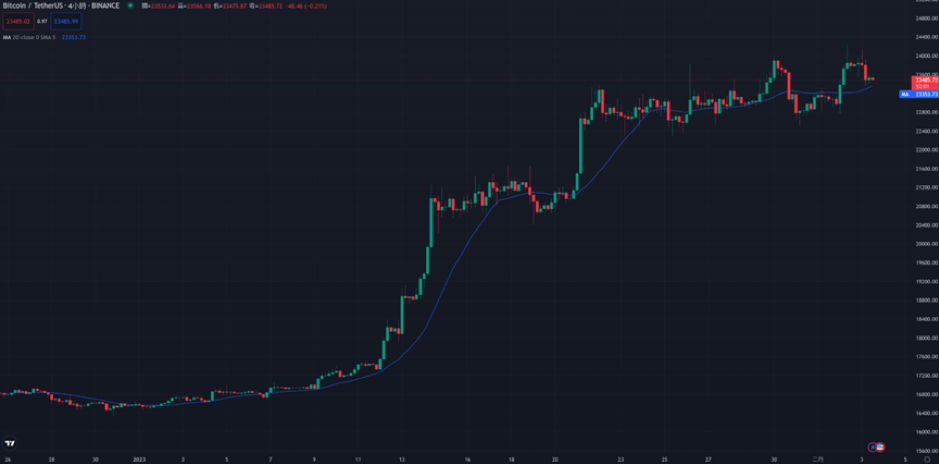
Source: TradingView
Exponential Moving Averages (EMA)
Exponential Moving Averages (EMA) is a refined version of Simple Moving Averages (SMA) that is more effective in detecting shifts in market trends. It serves as a technical indicator that calculates the average market price using an exponential smoothing formula. This approach weights recent prices more heavily compared to older ones, allowing the EMA to more efficiently track market trends than its simple moving average counterpart.
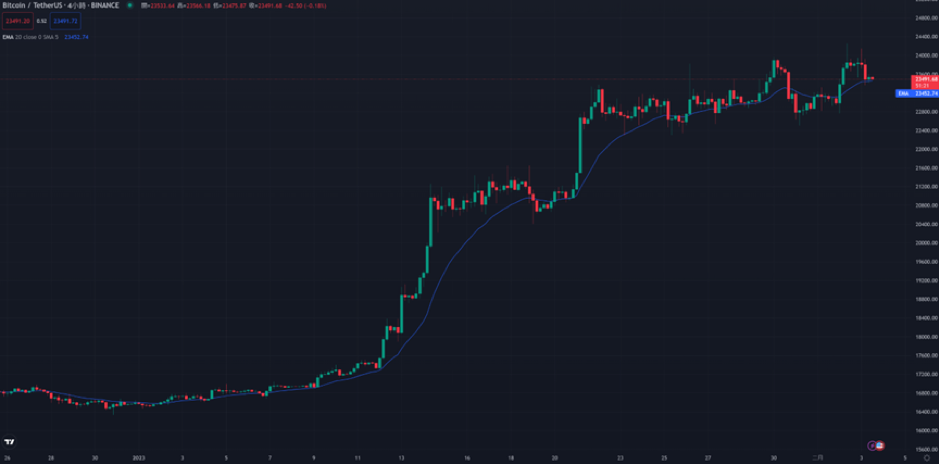
Source: TradingView
Bollinger Bands
Bollinger Bands are a widely used technical analysis indicator that provide traders with a relative definition of an asset's high and low prices. The bands are constructed by plotting a moving average and two standard deviation lines above and below the average, forming an envelop around the price of the asset. The resulting bands consist of an upper band, a middle band (the moving average), and a lower band. When the asset price rises above the upper Bollinger Band, it is considered a potential selling signal, while a price that falls below the lower Bollinger Band is viewed as a potential buying signal. Bollinger Bands provide traders with a means to measure volatility and make informed trading decisions based on the asset's price relative to the bands.
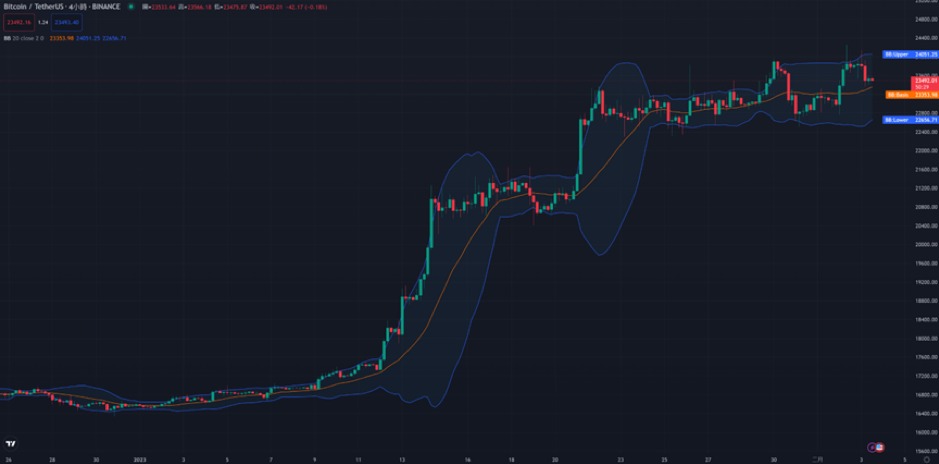
Source: TradingView
Relative Strength Index (RSI)
The Relative Strength Index (RSI) is a widely used technical indicator that measures the strength of an asset's price action by taking the average of gains and losses over a specified number of periods and calculating the ratio of positive changes to negative changes. The RSI ranges from 0 to 100 and higher values indicate that the asset's price has been largely rising, while lower values suggest significant price declines. Traders use the RSI to predict if an asset is overbought or oversold and generate buy and sell signals. A value above 70 is considered overbought and may indicate a potential selling opportunity, while a value below 30 is considered oversold and may signal a potential buying opportunity.
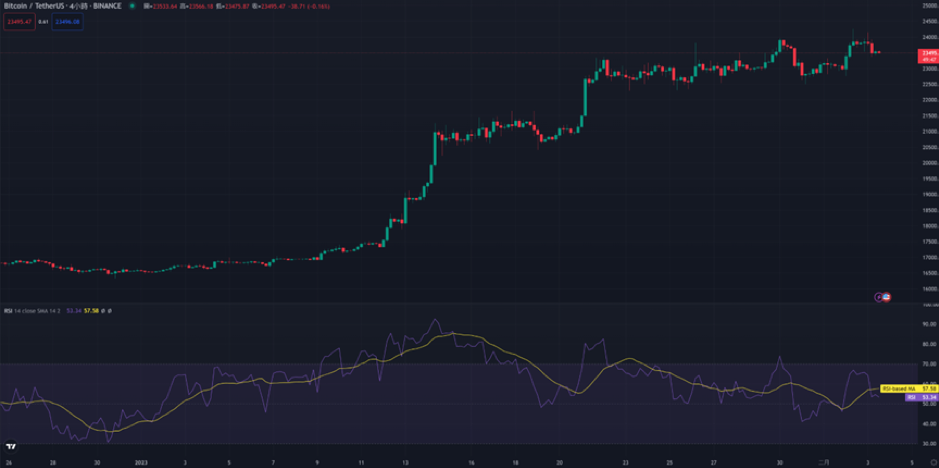
Source: TradingView
Conclusion
Technical analysis is a widely adopted method in the market due to its ease of use and ability to help traders make informed decisions. By presenting market trends and price movements through technical analysis, investors can quickly identify potential trading opportunities and minimize operational risk. Technical analysis uses data processing techniques to analyze vast amounts of market data, allowing for a systematic and timely prediction of market trends. While no analysis method can guarantee 100% accuracy, technical analysis can provide valuable insights and help investors to make informed decisions in a rapidly changing market.
FAQ
Q: How reliable is the use of chart or technical analysis in the cryptocurrency market?
A: Despite the cryptocurrency market being relatively young and more volatile compared to traditional financial markets like stocks, the principles of technical analysis remain relevant. Technical analysis is based on the idea that market trends reflect changes in supply and demand and market sentiment, which drive prices. As long as this principle holds true, technical analysis remains a valid tool for analyzing the cryptocurrency market.
Q: What is the most effective technical analysis for cryptocurrencies?
A: The Simple Moving Average (SMA), Exponential Moving Average (EMA), and Bollinger Bands are among the most commonly used and flexible technical indicators that can be applied to the cryptocurrency market. It's important to note that while these technical analysis tools are widely used, the most effective approach will vary among traders and may involve a combination of multiple analysis methods. Additionally, it's recommended to combine technical analysis with fundamental analysis and a well-defined trading strategy to make informed investment decisions in the cryptocurrency market.
This is not an investment advice. Please conduct your own research when investing in any project.


